This is the second part in a series outlining how I determined the leading factors that determine undergraduate introductory Computer Science experience by gender.
As part of my doctoral study, I decided to investigate the socio-curricular factors that affect the decision to participate in introductory computer science through a data-driven lens. To do this, I designed a research study examining the role of computer science self-identity centered around the experiences of undergraduates in two introductory computer science classes at UC Berkeley.
Once I completed that study, I didn't stop; I decided to ask new questions of the data. Specifically what were the leading factors that made female students choose intro CS? With that, the project I titled IntroCSExperiencePrediction was born.
To solve this problem, I will undertake the following course of action:
- Explore the dataset.
Explore the dataset to ensure its integrity and understand the context. - Identify features that I can potentially use.
If possible, I should engineer features which might provide greater discrimination of the dataset. - With the understanding that this a "classification" task, explore a couple of classifiers such as:
- Random Forest classifier
- eXtreme Gradient Boosted (XGBoost) trees classifier
- Support Vector Machine (SVM)
- Decision Tree classifier
- Select an appropriate classifier based on the evaluation metric and tune it for optimality.
- Extract the top features responsible for discriminating the data.
Evaluation Metrics
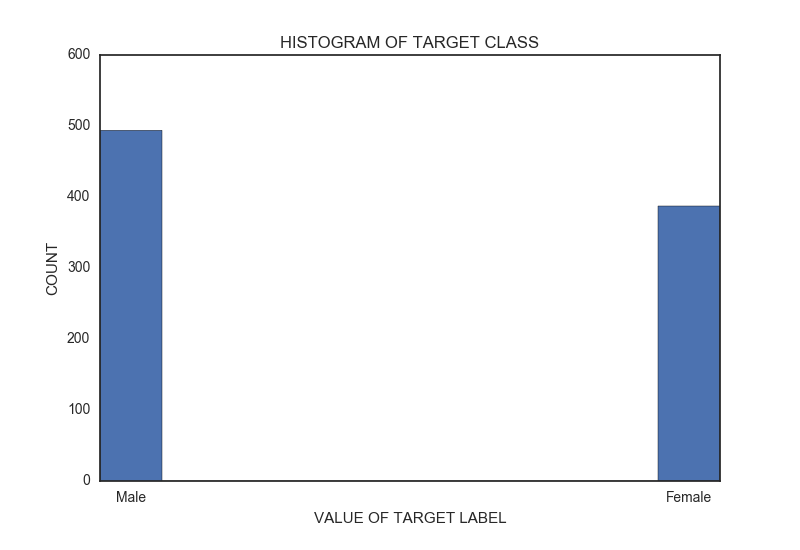
The student dataset that I will be using for this project has unbalanced classes as can be seen in the image above. It is important to pay attention to this class unbalance as it can cause the accuracy metric that is routinely used to judge classifiers to breakdown as the classes become more skewed.
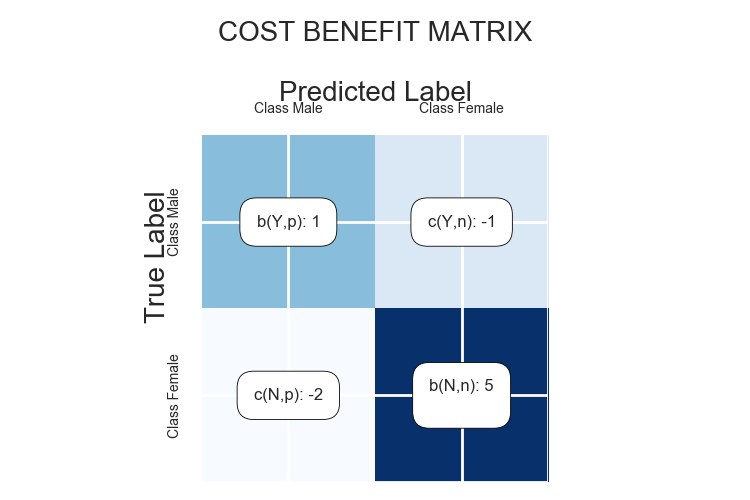
Taking into account the unbalanced dataset, and the nature of the problem itself, instead of using accuracy as my evaluation criteria, I will use the expected value framework. This structure allows me to evaluate each classifier concerning the "potential" business value of the decisions it makes on the data. In real life scenarios, there is often a cost associated with misclassifying data. To drive this idea home, permit me to take a detour into the world of credit assessment.
Machine learning applications are often used to determine whether a candidate should be given a loan or not. In this scenario, there is a real cost to a business if a good candidate is misclassified to be a risky candidate. When that happens, the business loses money it otherwise would have made from issuing the loan. So, in evaluating the effectiveness of a classifier in separating such a dataset, we want to have a cost associated with a misclassification and a reward/benefit associated with a correct classification. A way to do that is to use the expected value framework:


This equation states that the expected value of a classifier is the expected rates multiplied by the cost/benefit value of each entry in the confusion matrix, weighted by the class priors. For this project, I have assigned a penalty of -2 for each false classification of the female class and a reward of 5 for each correct assignment. I came up with this numbers arbitrarily based on my desire to pick the classifier that best separated out the female class.
Dataset
The dataset I used in this project consists of survey responses. I developed the questionnaire instruments to measure undergraduate students' self-reported attitudes along the following dimensions:
atcs: CS beliefsatcsgender: Gendered belief about CS abilityatcsjob: Career driven beliefs about CSatct: Computational thinking beliefsblg: CS belongingcltrcmp: Collegiality
Besides, I also collected data on students' background using the following dimensions.
prcs: Prior collegiate CS exposuremtr: CS mentors and role models- University demographics
The majority of the questionnaire I developed uses a 5-point Likert scale (where 1 = Strongly Disagree, 3 = Neutral and, 5 = Strongly Agree). I created a code book to facilitate my ease of analysis and the interpretability of results. A copy of the code book is at the end of this post. The dataset consists of 45 features with 882 instances. Further, the dataset breakdowns into 494 male cases versus 388 female examples.
Missing Values
The dataset with 45 features had two features with missing data.
priorcs10: 43.88% missingreason_class: 0.68% missing
Data Preprocessing
In preparation for classification, all features need to transform into a numeric format. This dataset has several non-numeric columns that need converting. Many of them take on yes and no values, e.g. prcs_2. I can reasonably convert these into 1/0 (binary) values. For the features whose values are Nan, I will convert this to the mean value of the feature. Further, I will remove all whitespaces from feature names because I know in advance that the tree plotting function for Xgboost will fail without de-spacing those names. In addition to the preprocessing I outlined, I will scale the dataset using a minimax scaler to ensure that I get a good output for the SVM algorithm.
Summarizing the Data
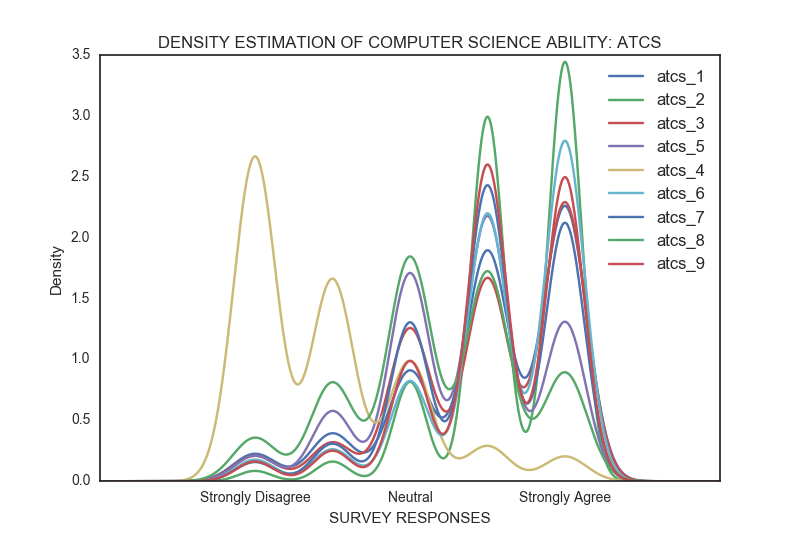
I created a density estimation for some dimensions in the data to gain a rough understanding of student experiences. The distributions of most of the dimensions looked very similarly to that of atcs. Most of the data is either skewed to the left or skewed to the right. As a result, I rejected using descriptive statistics to summarize the data in favor quantiles represented by box plots as can be seen in the figure below.
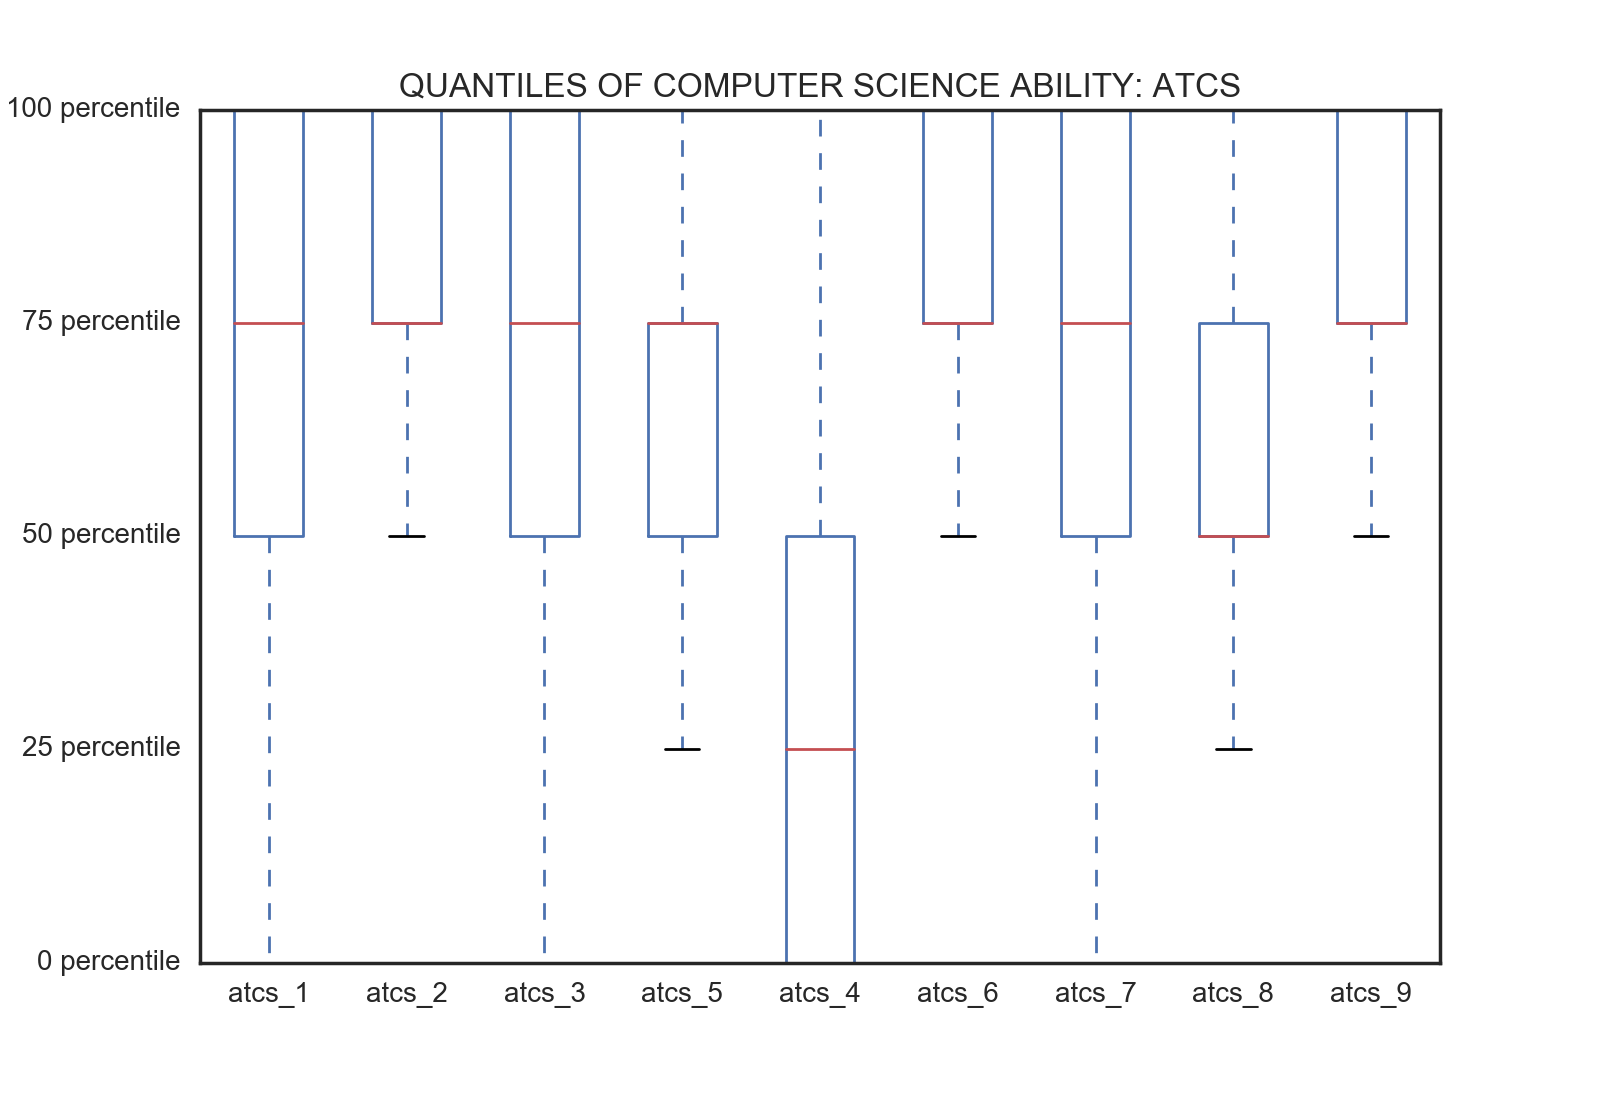
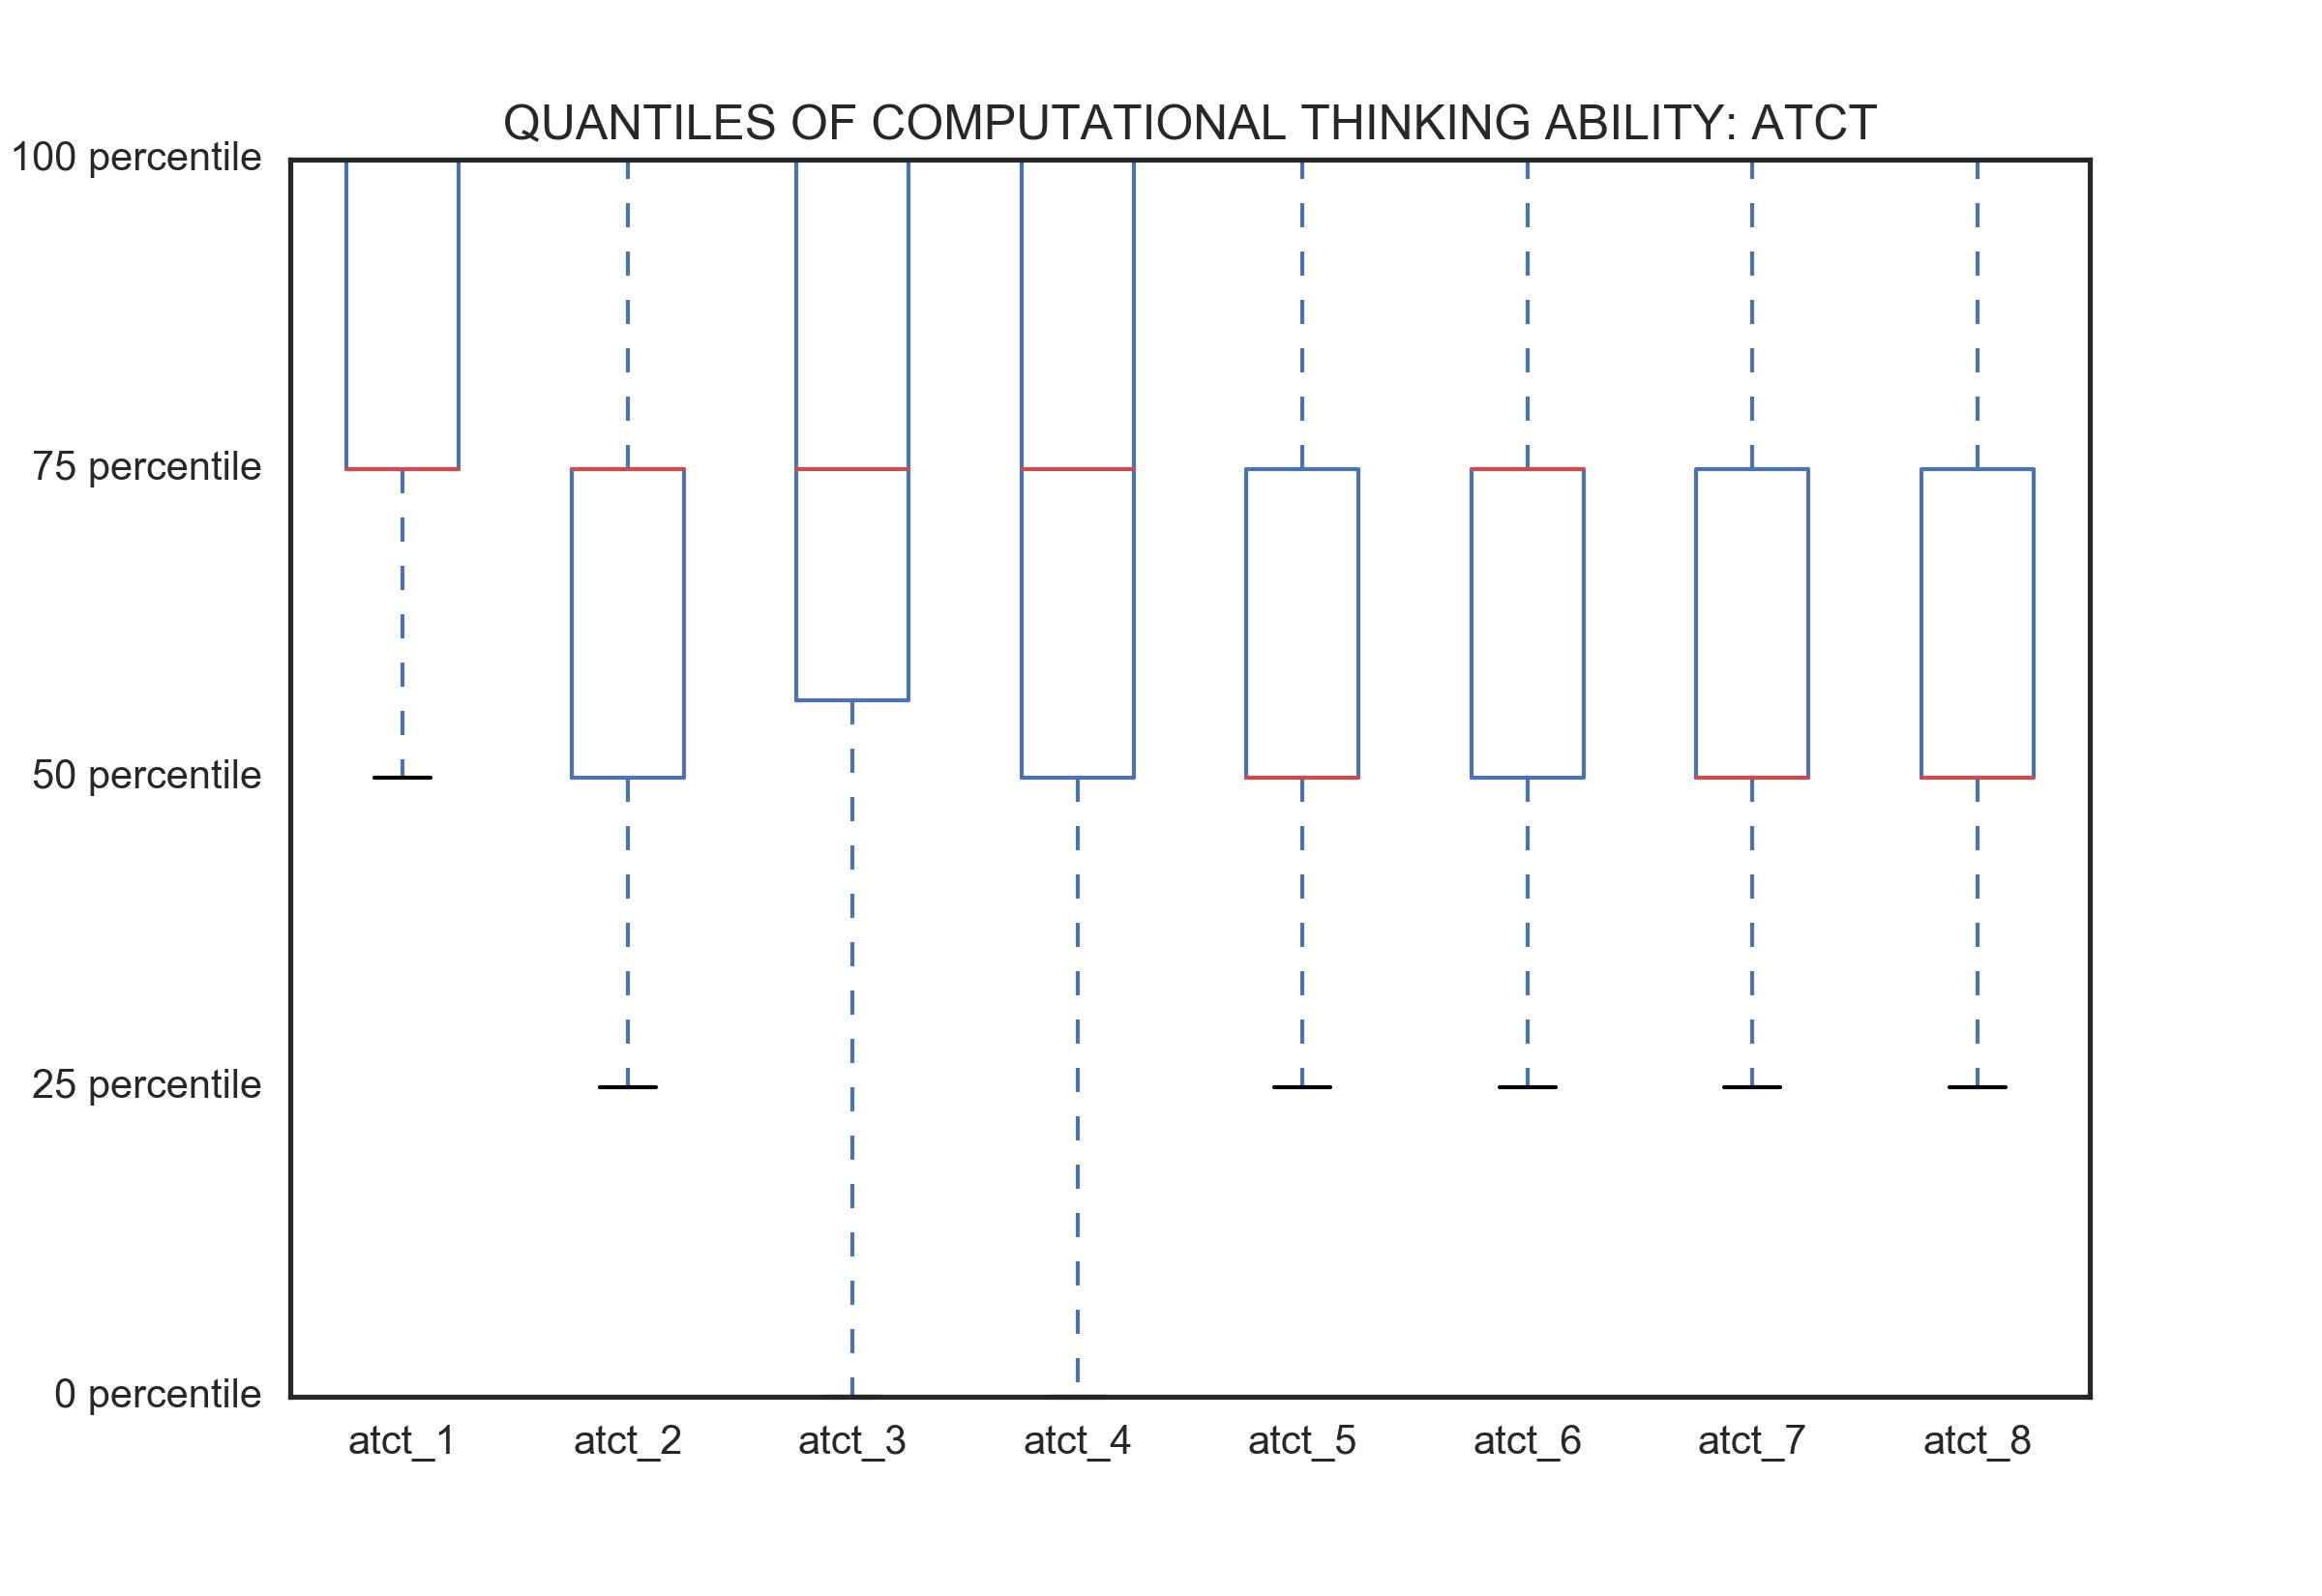
So what does image tell me about the data? From it, I can see that the median of this dimension is approximately at the 75 percentile, which based on the Likert scale dataset means that majority students agree with the attitudinal questions asked about their CS beliefs. For computational thinking, from the image below, I see that most of the data in this dimension also follows a similar distribution.
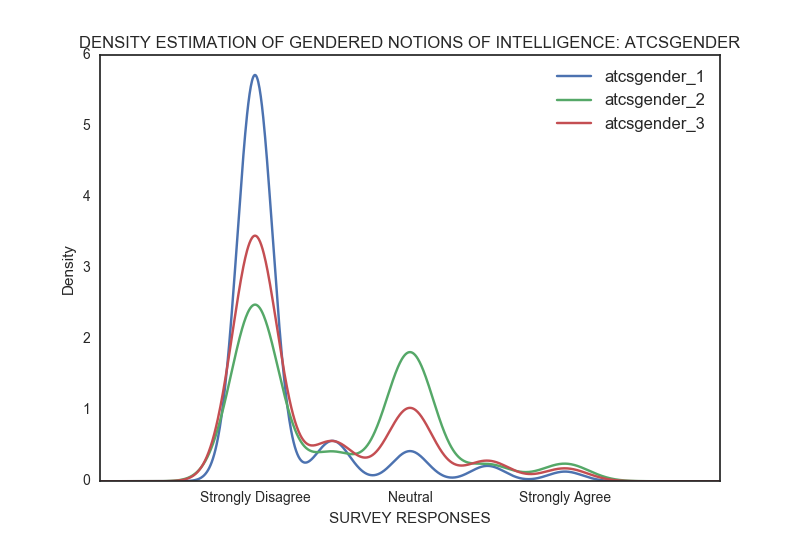
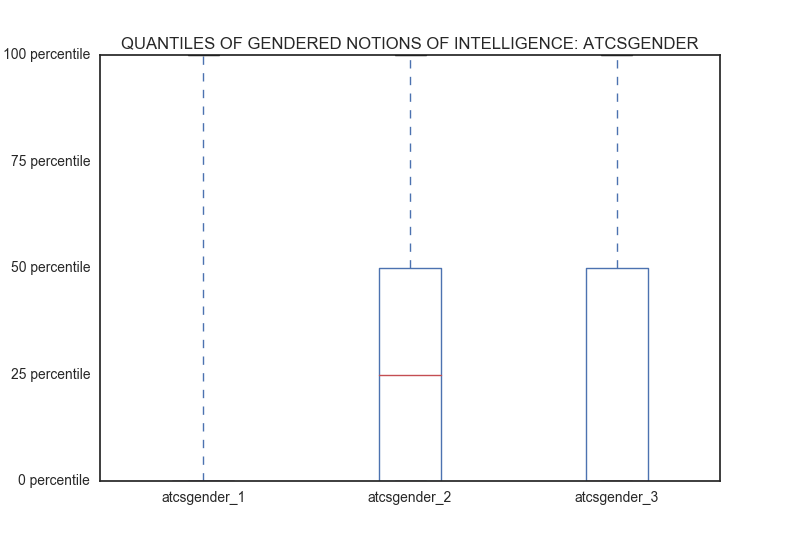
When it comes to gendered beliefs about CS ability, I can see that the distribution for the dimension atcsgender is really skewed to the right, i.e., most students strongly disagree with the statements. This finding does not come as a surprise, what I found fascinating is that the median for atcsgender_2 is at the 25 percentile, which corresponds to "neutral." You can see this in the boxplot in the image. While students do not agree that women are smarter than men, half of them are undecided about this statement!
atcsgender_1: Women are less capable of success in CS than men.atcsgender_2: Women are smarter than men.atcsgender_3: Men have better math and science abilities than women.
Next Steps
I have presented the first step in a project designed to identify the leading factors in understanding the cultural experience of introductory CS.
Next time, I will conclude the project by going through steps two through five. Those steps are captured in the blog post titled "CSExperiencePrediction: Part Three."
Coded Data instrument
Self-reported attitudes about CS
atcs_1I like to use computer science to solve problems.atcs_2I can learn to understand computing concepts.atcs_3I can achieve good grades (C or better) in computing courses.atcs_4I do not like using computer science to solve problems.atcs_5I am confident that I can solve problems by using computationatcs_6The challenge of solving problems using computer science appeals to me.atcs_7I am comfortable with learning computing concepts.atcs_8I am confident about my abilities with regards to computer science.atcs_9I do think I can learn to understand computing concepts.
Gendered belief about CS ability
atcsgender_1Women are less capable of success in CS than men.atcsgender_2Women are smarter than men.atcsgender_3Men have better math and science abilities than women.
Career driven beliefs about CS
atcsjob_1Knowledge of computing will allow me to secure a good job.atcsjob_2My career goals do not require that I learn computing skills.
Self-reported attitudes about computational thinking
atct_1I am good at solving a problem by thinking about similar problems I’ve solved before.atct_2I have good research skills.atct_3I am good at using online search tools.atct_4I am persistent at solving puzzles or logic problems.atct_5I know how to write computer programsatct_6I am good at building things.atct_7I’m good at ignoring irrelevant details to solve a problem.atct_8I know how to write a computer program to solve a problem.
Self-reported attitudes about CS class belonging
blg_1In this class, I feel I belong.blg_2In this class, I feel awkward and out of place.blg_3In this class, I feel like my ideas count.blg_4In this class, I feel like I matter.
Self-reported beliefs about collegiality
clet_1I work well in teams.clet_2I think about the ethical, legal, and social implications of computing.cltrcmp_1I am comfortable interacting with peers from different backgrounds than my own (based on race, sexuality, income, and so on.)cltrcmp_2I have go od cultural competence, or the ability to interact effectively with people from diverse backgrounds.
Demographics
genderCould I please know your gender
CS mentors and role models
mtr_1Before I came to UC Berkeley, I knew people who have careers in Computer Science.mtr_2There are people with careers in Computer Science who look like me.mtr_3I have role models within the Computer Science field that look like me.
Prior collegiate CS exposure
prcs_1Did you take a CS course in High School?prcs_2Did you have any exposure to Computer Science before UC Berkeley?prcs_3Did a family member introduce you to Computer Science?prcs_4Did you have a close family member who is a Computer Scientist or is affiliated with computing industry?prcs_5Did your high school offer AP CS?